Reliability Data Scientist · Lagos, Nigeria

Nnenna Henchard
Industrial AI for O&G Operations

15 Years O&G Operations · Predictive Maintenance · HSE Analytics · 3 Live Industrial AI Platforms
Production-grade industrial analytics platforms combining deep O&G field knowledge with machine learning — Docker-deployed, standards-aligned, and live on Streamlit Cloud.
Explore Platforms Connect on LinkedIn
15+
Years O&G Ops
3
Live Platforms
124
Automated Tests
0.9381
ROC-AUC (ORPMI)
About This Portfolio
O&G operations and HSE professional with 15+ years of field experience across upstream production, process safety, and regulatory compliance — now fully applied to reliability data science and industrial AI.
The three platforms here were built to solve real operational problems: predicting equipment failure before it causes downtime, making HSE compliance data-driven, and identifying high-risk departments before Lost Time Injuries occur.
Every platform is production-grade — ISO-aligned schema, temporal validation, Docker deployment, and automated test suites. Not tutorial exercises. Deployed systems.
Platform Suite — OPC-Alpha Offshore Facility

Portfolio
OPC-Alpha Analytics Suite
Three production-grade platforms built on a single simulated offshore production facility. Each platform deploys independently on Docker and Streamlit Cloud with full automated test suites.
⚙ ORPMI 🔧
Operational Reliability & Predictive Maintenance Intelligence
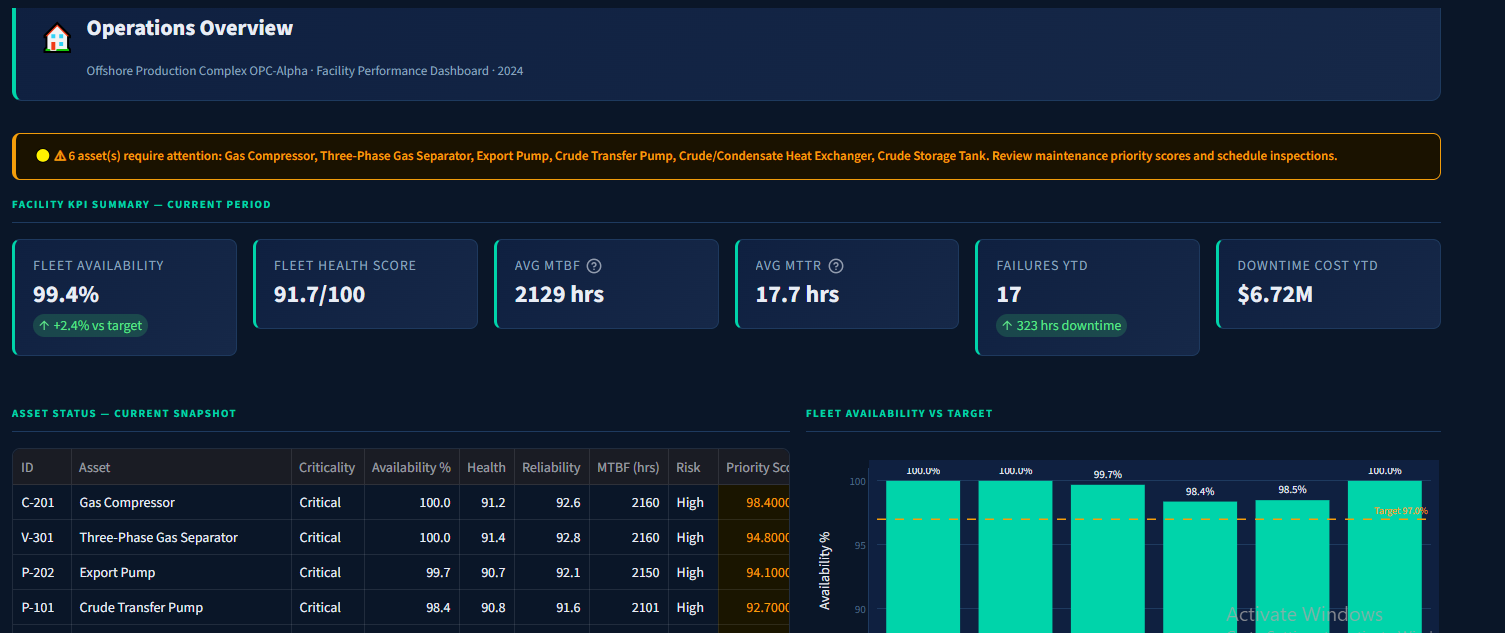
Predicts equipment failure 30 days ahead across 6 critical asset types
ORPMI Dashboard Preview
ORPMI helps Reliability Engineers move from reactive to predictive maintenance by predicting equipment failure 30 days ahead using a Random Forest model trained on 80 engineered features — vibration, temperature, pressure, efficiency, and maintenance history — aligned to ISO 14224 taxonomy.
0.9381
ROC-AUC
80
Features
10
Dashboard Pages
76 ✅
Tests Passing
ISO 14224 ISO 10816 Random Forest Temporal Validation Docker Streamlit SQLite
🛡 HSEI 📊
HSE Incident Analytics & Process Safety Intelligence
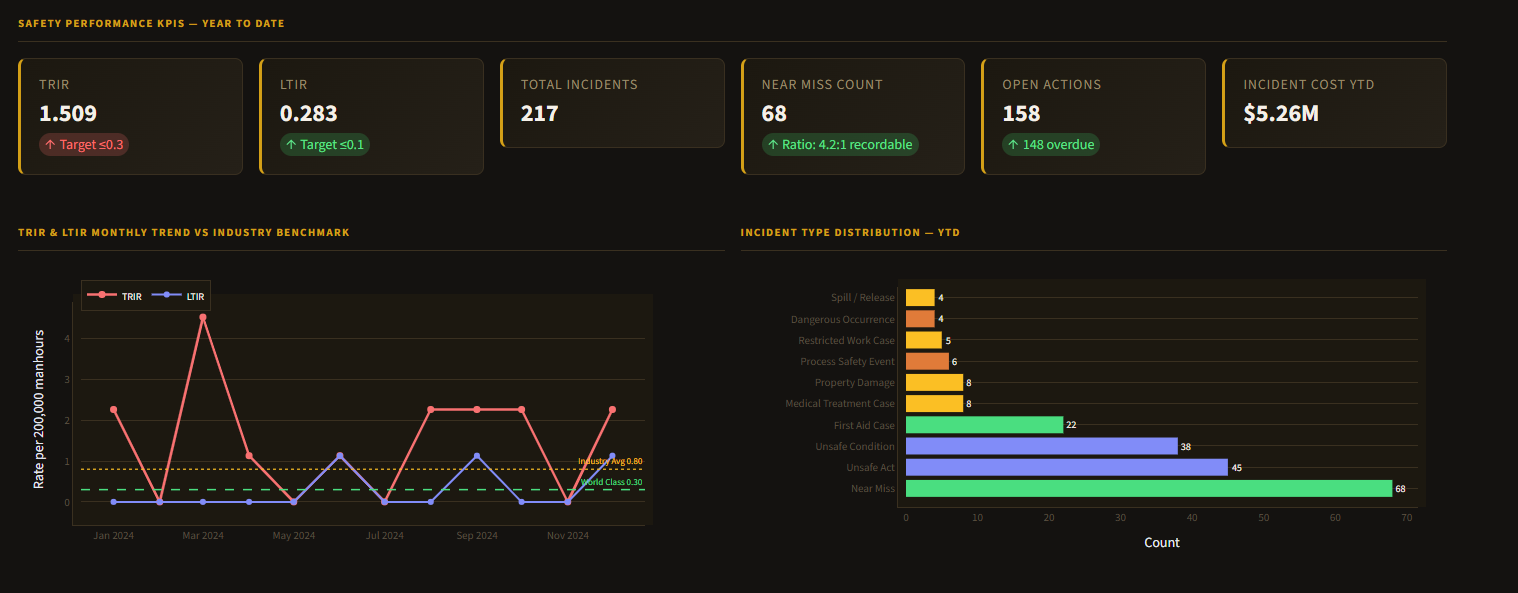
8-page executive HSE dashboard — API RP 754, ISO 45001, NUPRC & NOSDRA aligned
HSEI Dashboard Preview
HSEI helps HSE Managers and Operations Directors move from reactive compliance to proactive safety intelligence by embedding NUPRC and NOSDRA reporting requirements directly into the data schema — making regulatory reporting a database query, not a month-end manual exercise.
Tier 1–4
API RP 754
8
Dashboard Pages
NUPRC
Regulatory
29 ✅
Tests Passing
API RP 754 ISO 45001 NUPRC NOSDRA Docker Streamlit SQLite
🎯 HSIP 🔮
HSE Incident Prediction & Safety Culture Intelligence
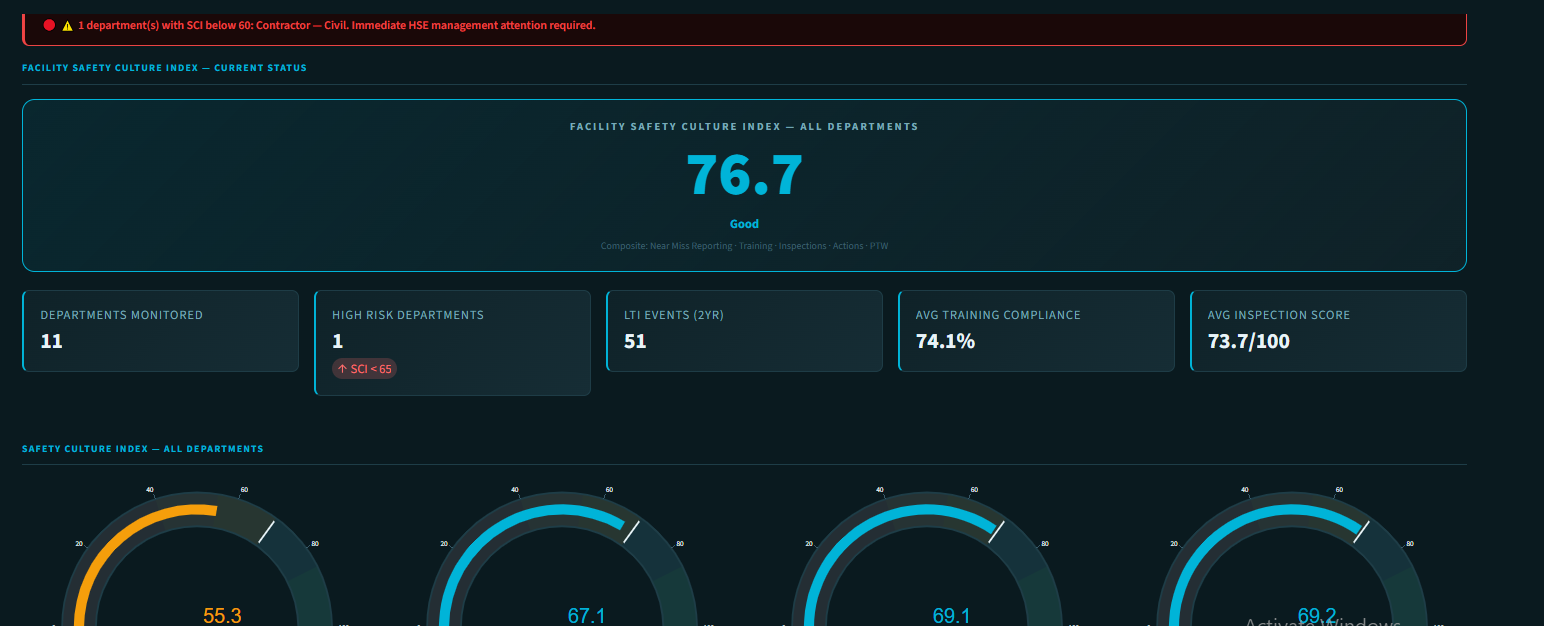
Predicts Lost Time Injury probability 30 days ahead across 11 operational departments
HSIP Dashboard Preview
HSIP helps Safety Leaders identify high-risk departments before incidents occur by combining five leading indicators into a composite Safety Culture Index (SCI) and using a calibrated Gradient Boosting model to predict 30-day LTI probability per department.
30-day
LTI Horizon
11
Departments
SCI
Composite Score
19 ✅
Tests Passing
ISO 45001 Gradient Boosting Isotonic Calibration Safety Culture Index Docker Streamlit

Case Studies
From Problem to Production
Each platform was built to solve a specific operational problem. Here is the design thinking behind each one.
⚙ ORPMI — Predictive Maintenance Intelligence
Case Study
Business Problem
Unplanned equipment failure on offshore production facilities is one of the costliest operational risks in Oil & Gas — driving emergency maintenance, lost production, and regulatory exposure. Maintenance teams typically lack early warning systems that account for the full operational context of each asset type: vibration thresholds, maintenance history, and degradation trajectory together.
Solution Built
ORPMI — a predictive maintenance platform aligned to ISO 14224, using a Random Forest model trained on 80 engineered features across vibration, temperature, pressure, efficiency, and maintenance history. 10-page executive dashboard with asset health monitoring, failure probability gauges, and maintenance recommendations with cost framing.
Key Design Decisions
Temporal validation — train Jan–Sep, test Oct–Dec. Random k-fold leaks future data into training and inflates metrics that will not hold in production.

ISO 14224 schema — mirrors production CMMS architecture so the platform integrates with real systems without translation layers.

Threshold at 0.4 — a business decision. Missing a failure (false negative) costs far more than a false alarm (false positive) in a PdM context.
Results
ROC-AUC 0.9381 Recall 0.294 F1 0.454 80 Features 76 Tests ✅ Docker Deployed
What I Would Change for Production
Real sensor data via MQTT/OPC-UA integration · Scheduled retraining pipeline with MLflow model registry · Model monitoring dashboard for drift detection · Role-based access control · Integration with existing CMMS work order systems
🛡 HSEI — HSE Incident Analytics
Case Study
Business Problem
HSE compliance reporting in Nigerian upstream operations is largely manual — incident data collected on paper, regulatory submissions to NUPRC and NOSDRA compiled at month-end from multiple Excel files, and corrective actions tracked informally with no visibility into close-out rates between audits.
Solution Built
HSEI — an 8-page executive HSE analytics platform with API RP 754 Tier 1–4 classification, ISO 45001 leading indicator framework, and NUPRC and NOSDRA reporting fields embedded as structural database design decisions. Compliance reporting becomes a query, not a manual exercise.
Key Design Decisions
NUPRC and NOSDRA at schema level — not added as afterthoughts but designed into the data model from the start. Every incident is classified on intake.

API RP 754 Tier 1–4 — Tier 1 and 2 events automatically flagged as regulatory reportable, matching the exact workflow used by Nigerian IOC operations teams.

Leading vs lagging separation — the dashboard surfaces observation rates, near-miss frequency, and CAPA close-out rates alongside TRIR and LTIR.
Results
8 Dashboard Pages API RP 754 NUPRC Aligned NOSDRA Aligned 29 Tests ✅ Docker Deployed
What I Would Change for Production
Live integration with NUPRC/NOSDRA submission portals · Automated email alerts for overdue CAPAs · Mobile-responsive incident reporting form for field staff · Integration with permit-to-work management system · Role-based access distinguishing field, supervisor, and management views
🎯 HSIP — LTI Prediction & Safety Culture Intelligence
Case Study
Business Problem
Lost Time Injuries are tracked after they happen. The leading indicators that predict where the next LTI will occur — observation rates, training compliance, CAPA close-out rates — are either not collected systematically or not connected to safety outcome prediction.
Solution Built
HSIP — a safety culture intelligence platform that combines five leading indicators into a composite Safety Culture Index (SCI) and uses a calibrated Gradient Boosting model to predict 30-day LTI probability per department. Validated on 2,288 weekly records across 11 operational departments.
Key Design Decisions
Isotonic calibration — the model's output is presented as a true probability, not just a relative score. A prediction of 0.68 means approximately 68% of departments with this profile had an LTI within 30 days — a number a safety manager can act on.

Evidence-based SCI weights — near-miss reporting rate (25%) and training compliance (25%) weighted highest based on their empirical correlation with LTI rates in the training data.

Department-level granularity — predictions are per department, not per facility, enabling targeted intervention rather than blanket campaigns.
Results
30-Day LTI Prediction 11 Departments 2,288 Records Calibrated Output 19 Tests ✅ Docker Deployed
What I Would Change for Production
Real incident and observation data from CMMS and HSE systems · Automated weekly SCI calculation triggered by data pipeline · Push alerts to department managers when SCI drops below 65 · Integration with HSEI platform for unified HSE analytics view · A/B testing framework to measure effectiveness of safety interventions

System Design
Platform Architecture — ORPMI
Each platform follows the same layered architecture — from data entry through to executive dashboard — with inline auto-setup on first launch.
ORPMI — End-to-End Data Flow
Data Entry ──→ SQLite Database ──→ ETL Pipeline
ISO 14224 schema · 7 tables · 29 validations

ETL Pipeline ──→ Feature Engineering ──→ Random Forest Model
80 features · rolling stats · MTBF trajectory class_weight=balanced · threshold=0.4

Random Forest Model ──→ Streamlit Dashboard
10 pages · asset health · failure probability · KPIs

Docker-deployed · Streamlit Cloud · Auto-setup on first launch · 76 automated tests

Technical Stack
Skills & Standards
15 years of O&G operations domain knowledge combined with production-grade data science capability.
Programming & Data
Python 3.11 SQL Pandas NumPy Scikit-Learn XGBoost SQLAlchemy SQLite
Deployment & Visualisation
Streamlit Docker Plotly Power BI Git GitHub pytest Excel
Standards & Domain
ISO 14224 API RP 754 ISO 45001 ISO 10816 NUPRC NOSDRA MTBF / MTTR TRIR / LTIR HAZOP OIMS
Machine Learning
Random Forest Gradient Boosting Isotonic Calibration Feature Engineering Temporal Validation Class Imbalance ETL Pipelines
O&G Operations
Reliability Engineering Predictive Maintenance HSE Management Process Safety NEBOSH IGC Tank Farm Ops CMMS RCM
Certifications
NEBOSH IGC — 2013 Aspen Hysys — 2008 Python DS — Codebasics 2025 SQL DS — Codebasics 2025 B.Sc Industrial Chemistry

Let's Connect
If you are working on reliability, maintenance analytics, or HSE intelligence in Oil & Gas — I am always open to a conversation.